

Decision markets, as popularized by MetaDAO, build on the logic of prediction markets, but instead of forecasting external events, they price the value impact of competing decisions that affect the DAO.
For every proposal, capital is divided between two conditional pools. One where the proposal executes and one where it does not. The system compares their time weighted average prices (TWAP) during a window of time. A proposal passes only when the “Approved” market consistently prices the token as more valuable than the “Rejected” market by more than the configured threshold. The spread between those two conditional markets is the signal.
To interpret that signal correctly, you need to understand how it forms, how capital aligns economically, and how conviction persists during the TWAP window. 01Resolved makes what you should be paying attention to clear, and this guide explains how to dissect a decision market from first principles.
Price Edge vs Threshold Chart
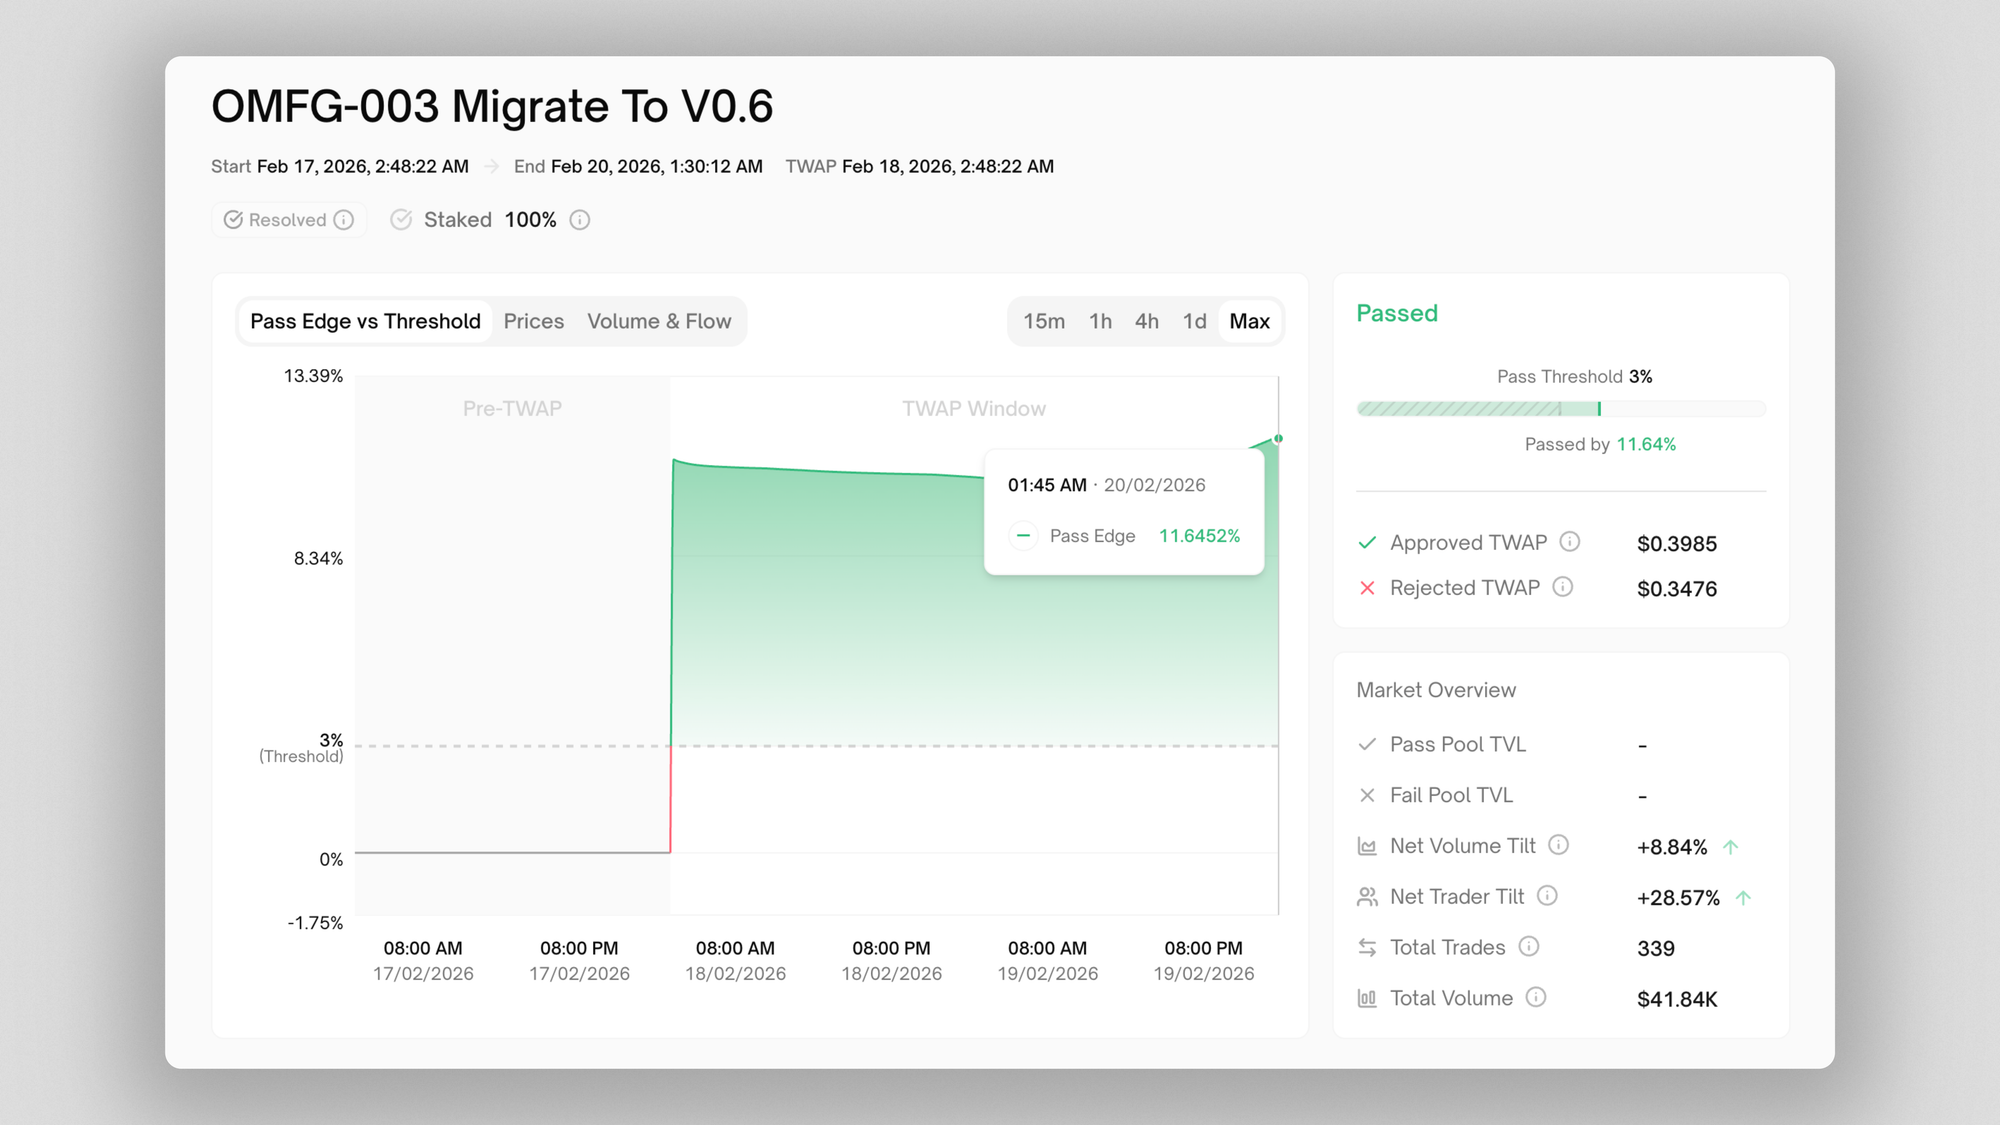
The Price Edge vs Threshold is the most important decision market visualization.
It shows the Pass Edge, which is the percentage spread between the Approve TWAP and Reject TWAP, plotted against the proposals configured pass threshold (e.g. 3%).
Simply put, the Pass Edge tells you at a glance if the proposal is passing and by what percentage.
The horizontal dashed line at 3% is the threshold requirement. The Pass Edge must clear this 3% mark in order for the decision market to resolve Approved.
The green shaded region represents the actual edge during the TWAP window.
For OMFG-003, the final edge was +11.64%, well above the 3% threshold. That’s why the proposal was approved.
The chart separates the Pre-TWAP and TWAP windows. Only prices during the TWAP window count toward execution. Pre-TWAP trading shapes expectations but does not finalize the outcome.
Prices Chart
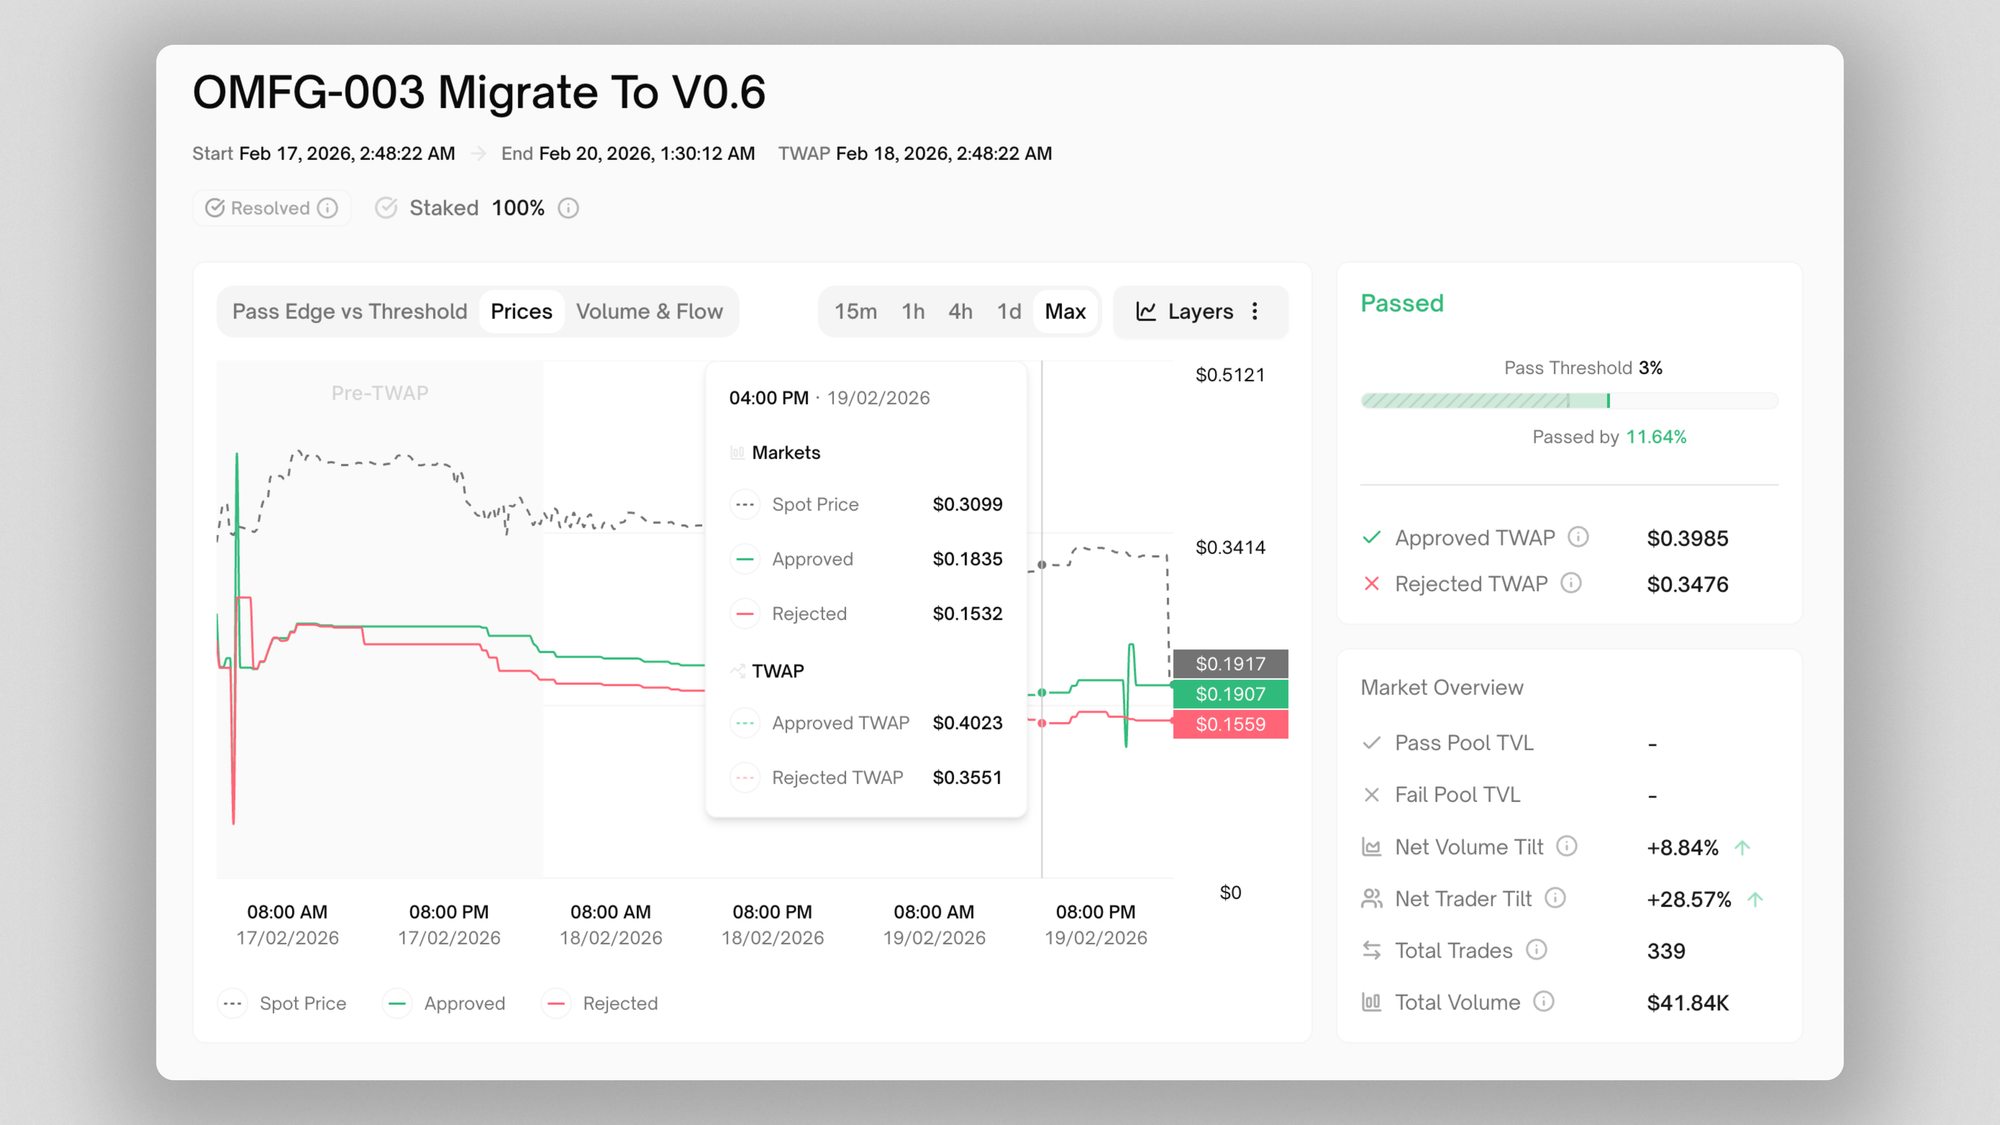
The Prices chart shows the microstructure behind that edge. In it, you see the following price curves:
- Spot price (grey dashed)
- Approved market price (green)
- Rejected market price (red)
- Approved TWAP (green dashed)
- Rejected TWAP (red dashed)
During trading, capital flows into two separate conditional AMMs. One for “Approved” and one for “Rejected.” Traders can buy a side if they believe that outcome increases long-term value, pushing its price up. They can also sell (or trade against) a side if they believe it destroys value, pushing its price down. Each trade updates the AMM price in real time, and those prices feed into the TWAP calculation during the decision window.
Since the FutarchyAMM shares liquidity between both the Pass and Fail markets, capital must meaningfully commit to one side, ensuring the resulting price gap reflects real economic conviction.
Volume & Flow Chart
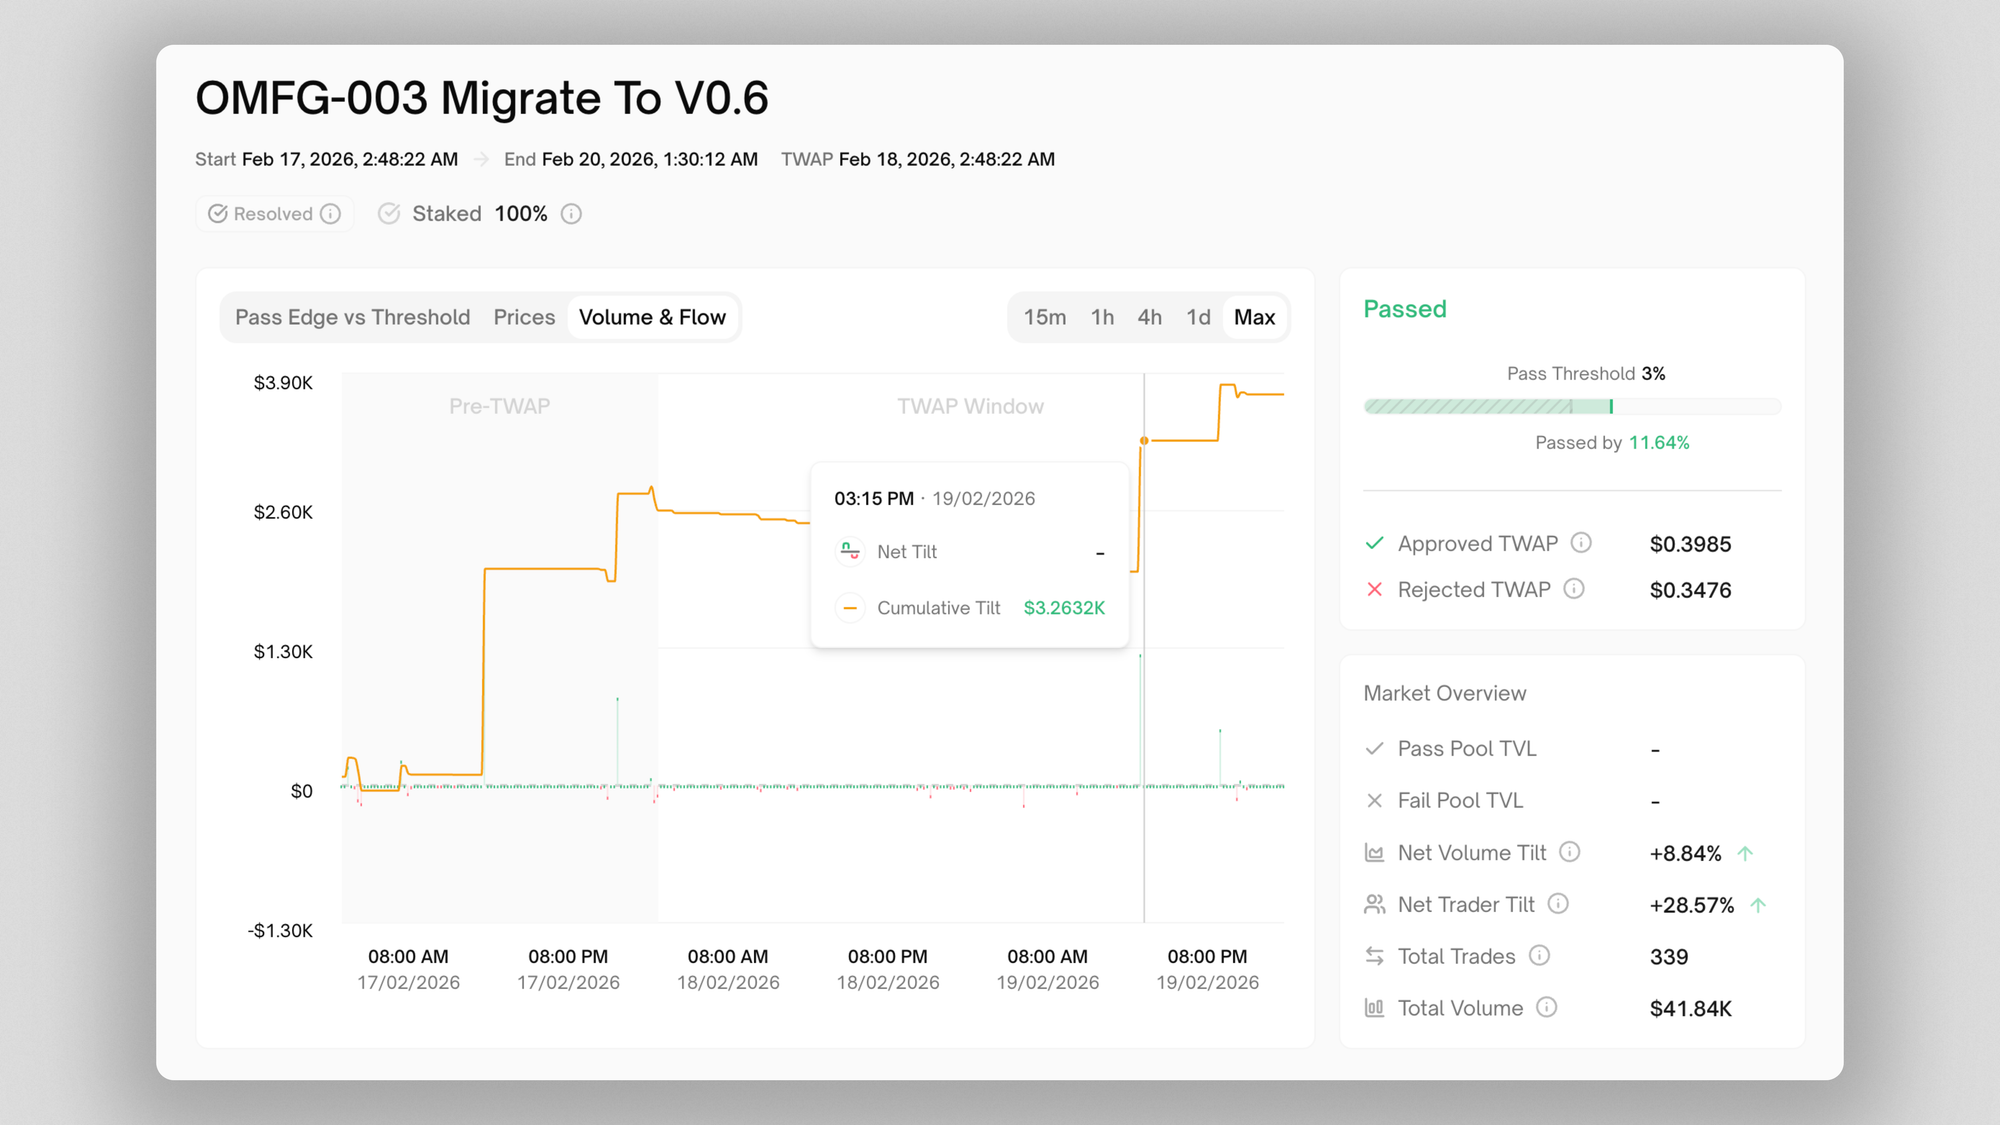
The Volume & Flow chart shows how capital flowed between the Approved and Rejected markets over time.
The orange line tracks cumulative net volume tilt, the running total of capital committed to pass-aligned markets minus capital committed to fail-aligned markets. When it trends upward, more capital has flowed into Pass; when it trends downward, more capital has flowed into Fail.
The green and red bars show net directional volume per interval. Green bars indicate that, during that time window, more capital moved into Pass than Fail. Red bars indicate the opposite.
For OMFG-003:
- Net Volume Tilt: +8.84%
- Net Trader Tilt: +28.57%
- Total Volume: $41.84K
- Total Trades: 339
Net Pass Volume Tilt measures the directional imbalance of capital between the two conditional markets. The formula is:
Net Pass Volume Tilt = (Pass-Buy Volume + Fail-Sell Volume) − (Pass-Sell Volume − Fail-Buy Volume) / Total Volume
Net Pass Trader Tilt measures participation imbalance rather than capital size. The formula is:
Net Pass Trader Tilt = (Pass-Buy Trades + Fail-Sell Trades) − (Pass-Sell Trades − Fail-Buy Trades) / Total Trades
Outcome Strength
This section summarizes directional alignment at resolution, both by traders and by capital.
Traders by Economic Direction
This measures how many unique traders were economically aligned with Pass versus Fail.
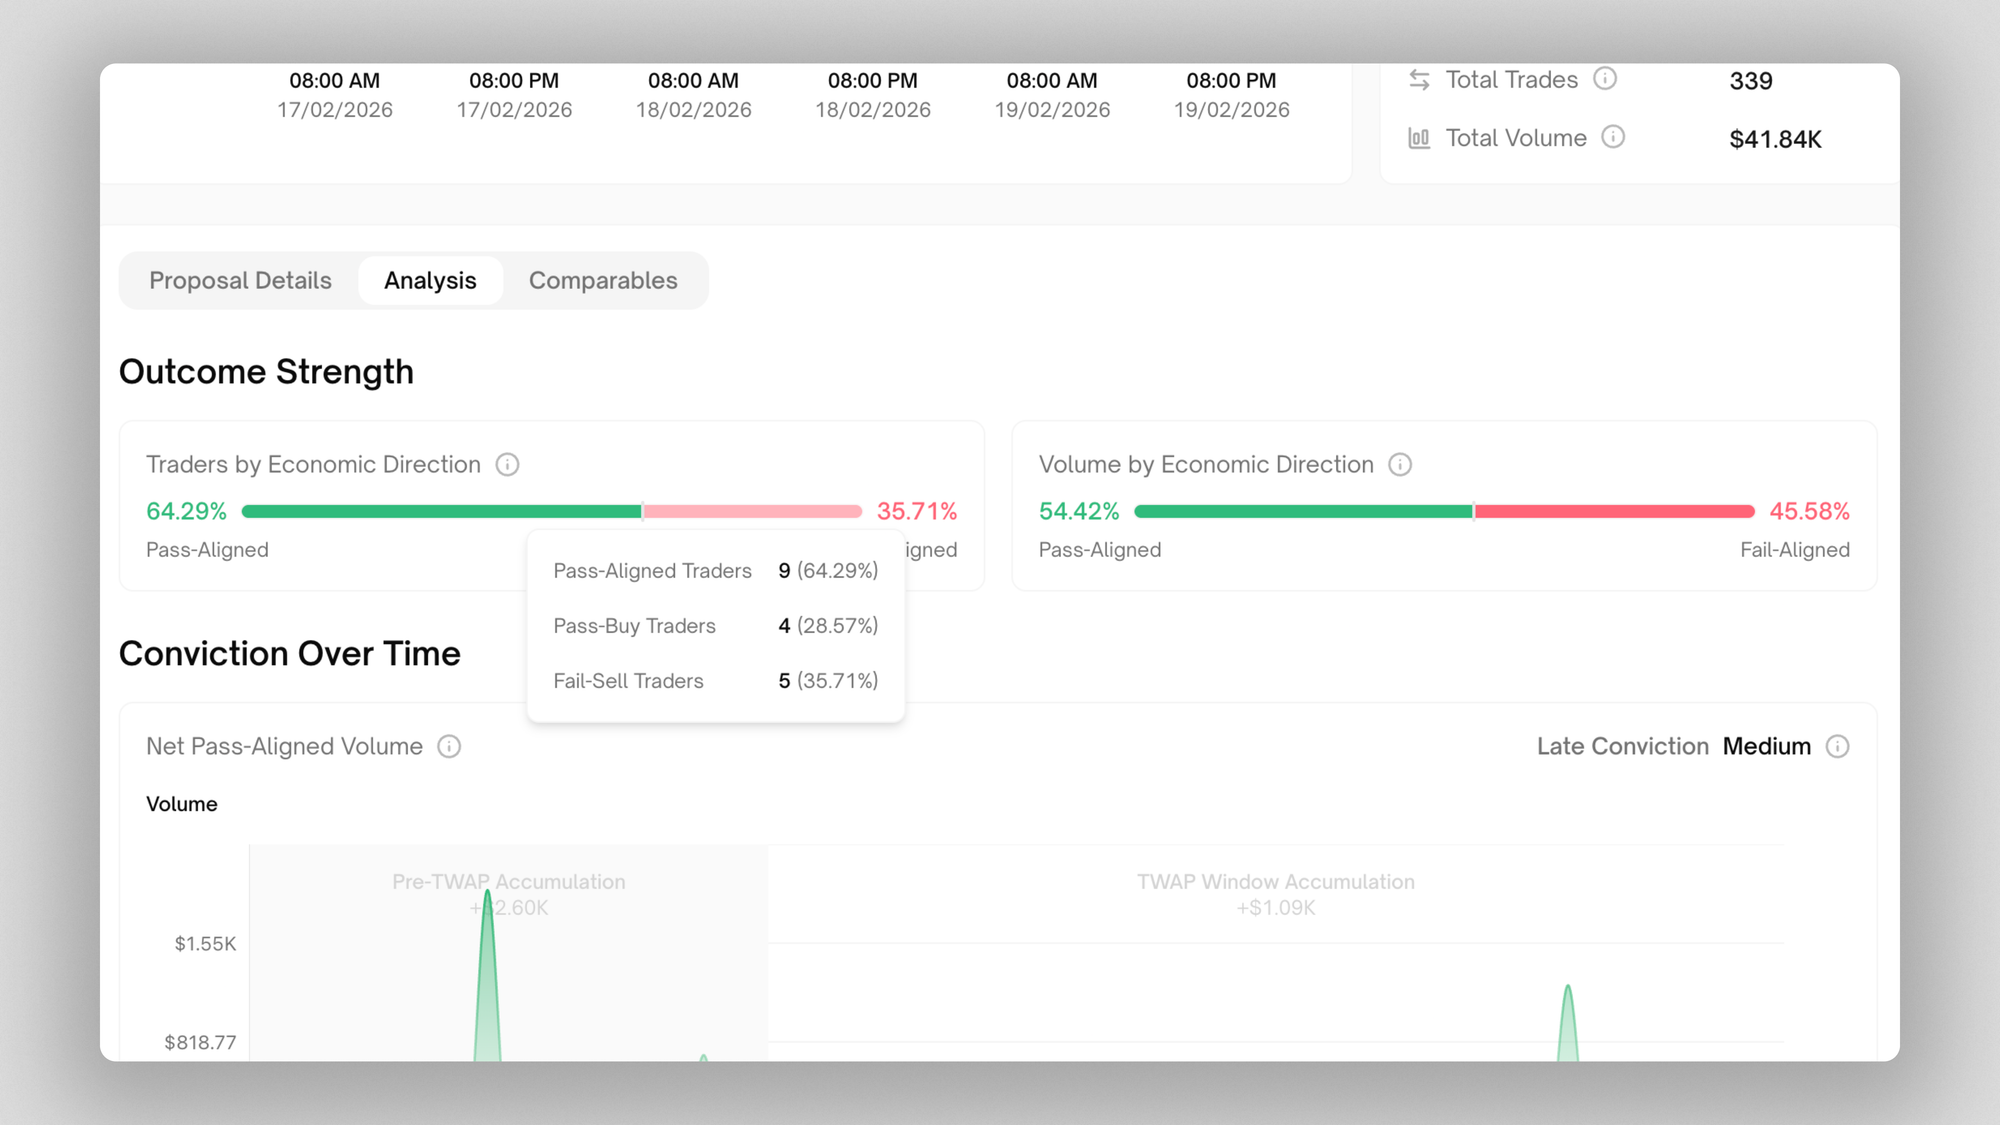
A trader is considered pass-aligned if their net position benefits from the proposal passing. A pass-aligned trader would trade pass-buy or fail-sell. A trader is considered fail-aligned if their net position benefits from the proposal failing. A fail-aligned trader would trade pass-sell or fail-buy.
This accounts for buys and sells across both conditional markets. It reflects net economic exposure, not just one-sided trades.
For OMFG-003:
- 64.29% of traders were pass-aligned
- 35.71% were fail-aligned
This shows broad participation skewed toward Approval. The hover breakdown clarifies composition:
- Pass-Buy traders (explicitly buying Pass)
- Fail-Sell traders (selling Fail, which is economically equivalent to buying Pass)
The economic direction is defined by payoff exposure, not surface trade type.
Volume by Economic Direction
This applies the same concept to dollars instead of traders.
Pass-Aligned Volume includes:
- Pass buys
- Fail sells
Fail-Aligned Volume includes:
- Fail buys
- Pass sells
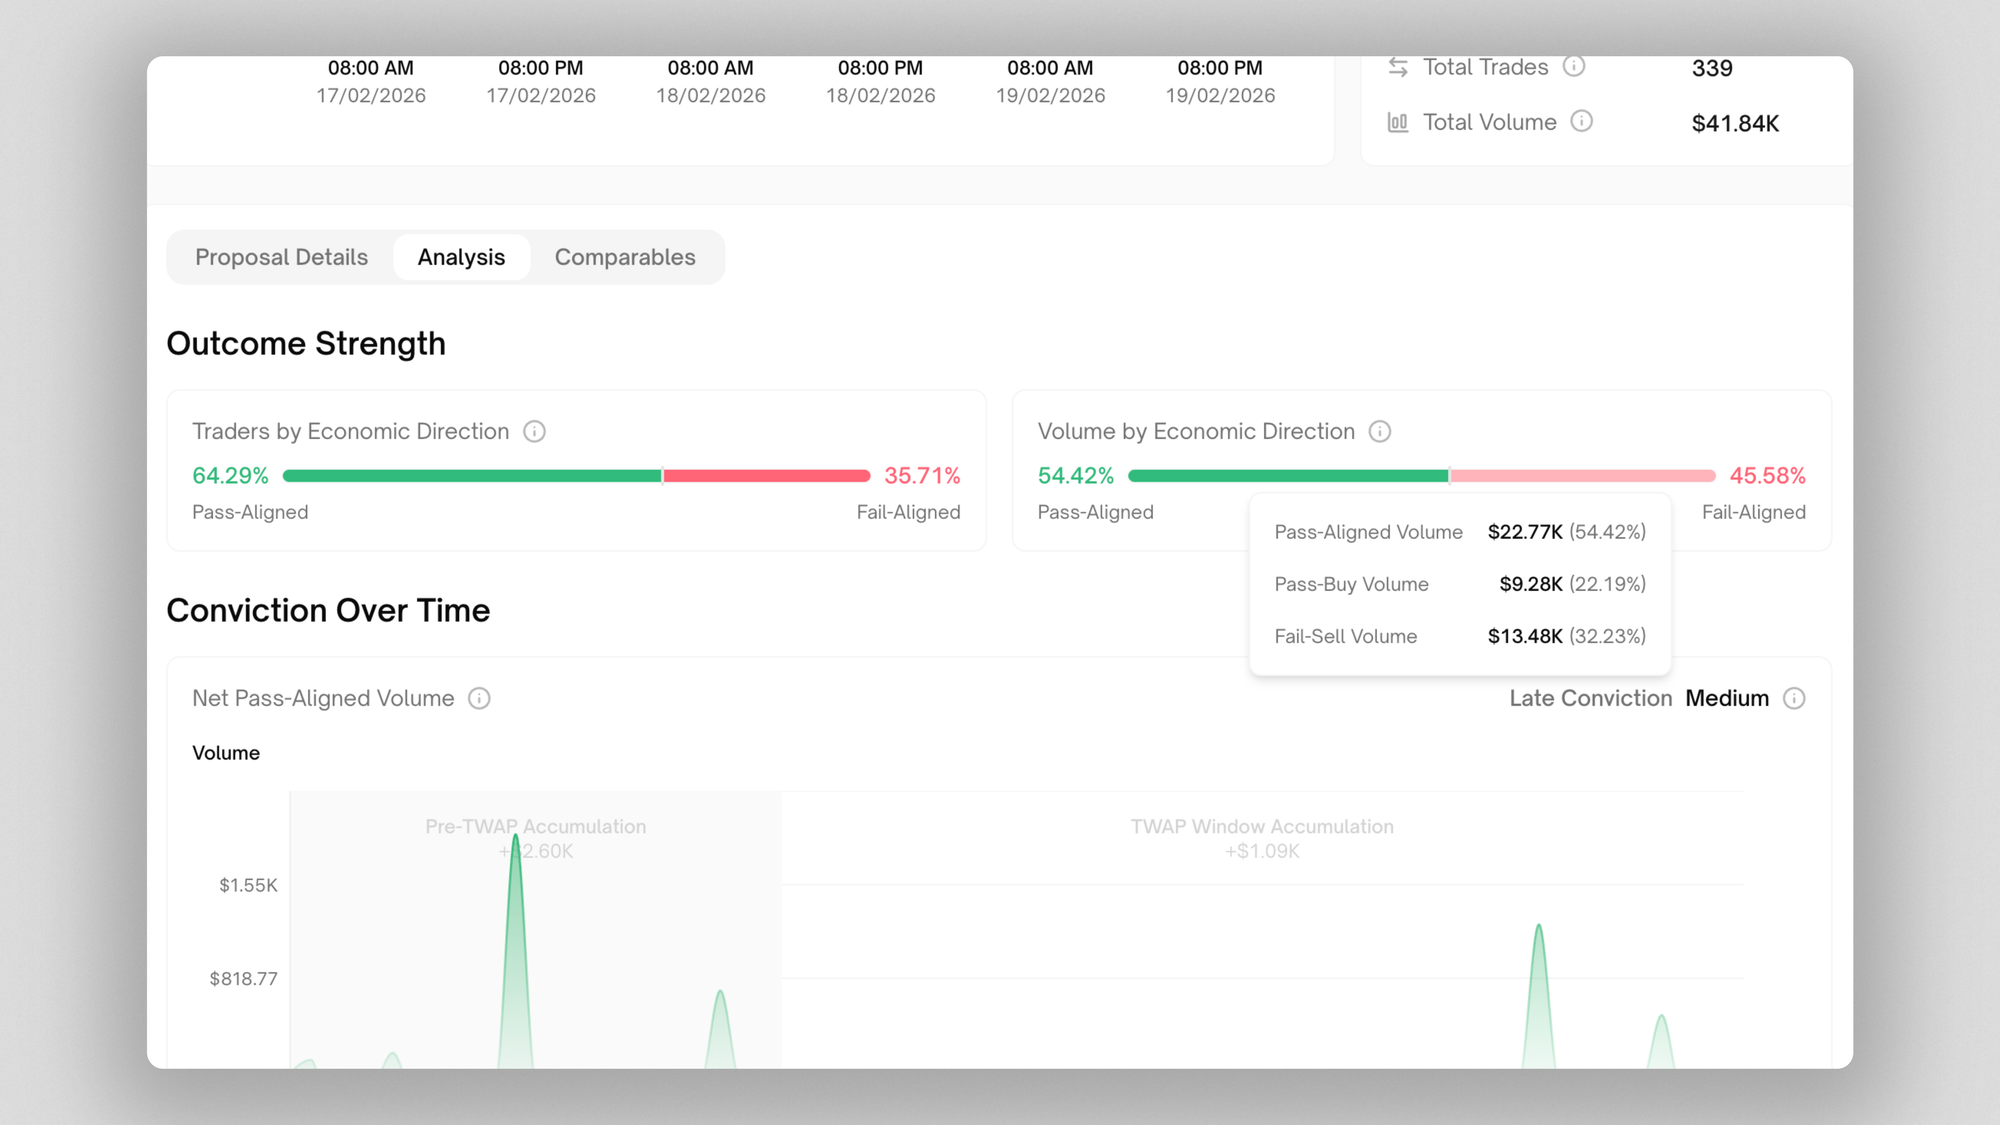
For OMFG-003:
- 54.42% of total volume was Pass-Aligned
- 45.58% was Fail-Aligned
This confirms that not only more traders leaned Pass, but more capital did as well, though the capital skew was more moderate than the trader skew.
This helps identify whether alignment was broadly distributed or whale-centric.
Conviction Over Time
The Net Pass-Aligned Volume chart shows directional economic flow over time:
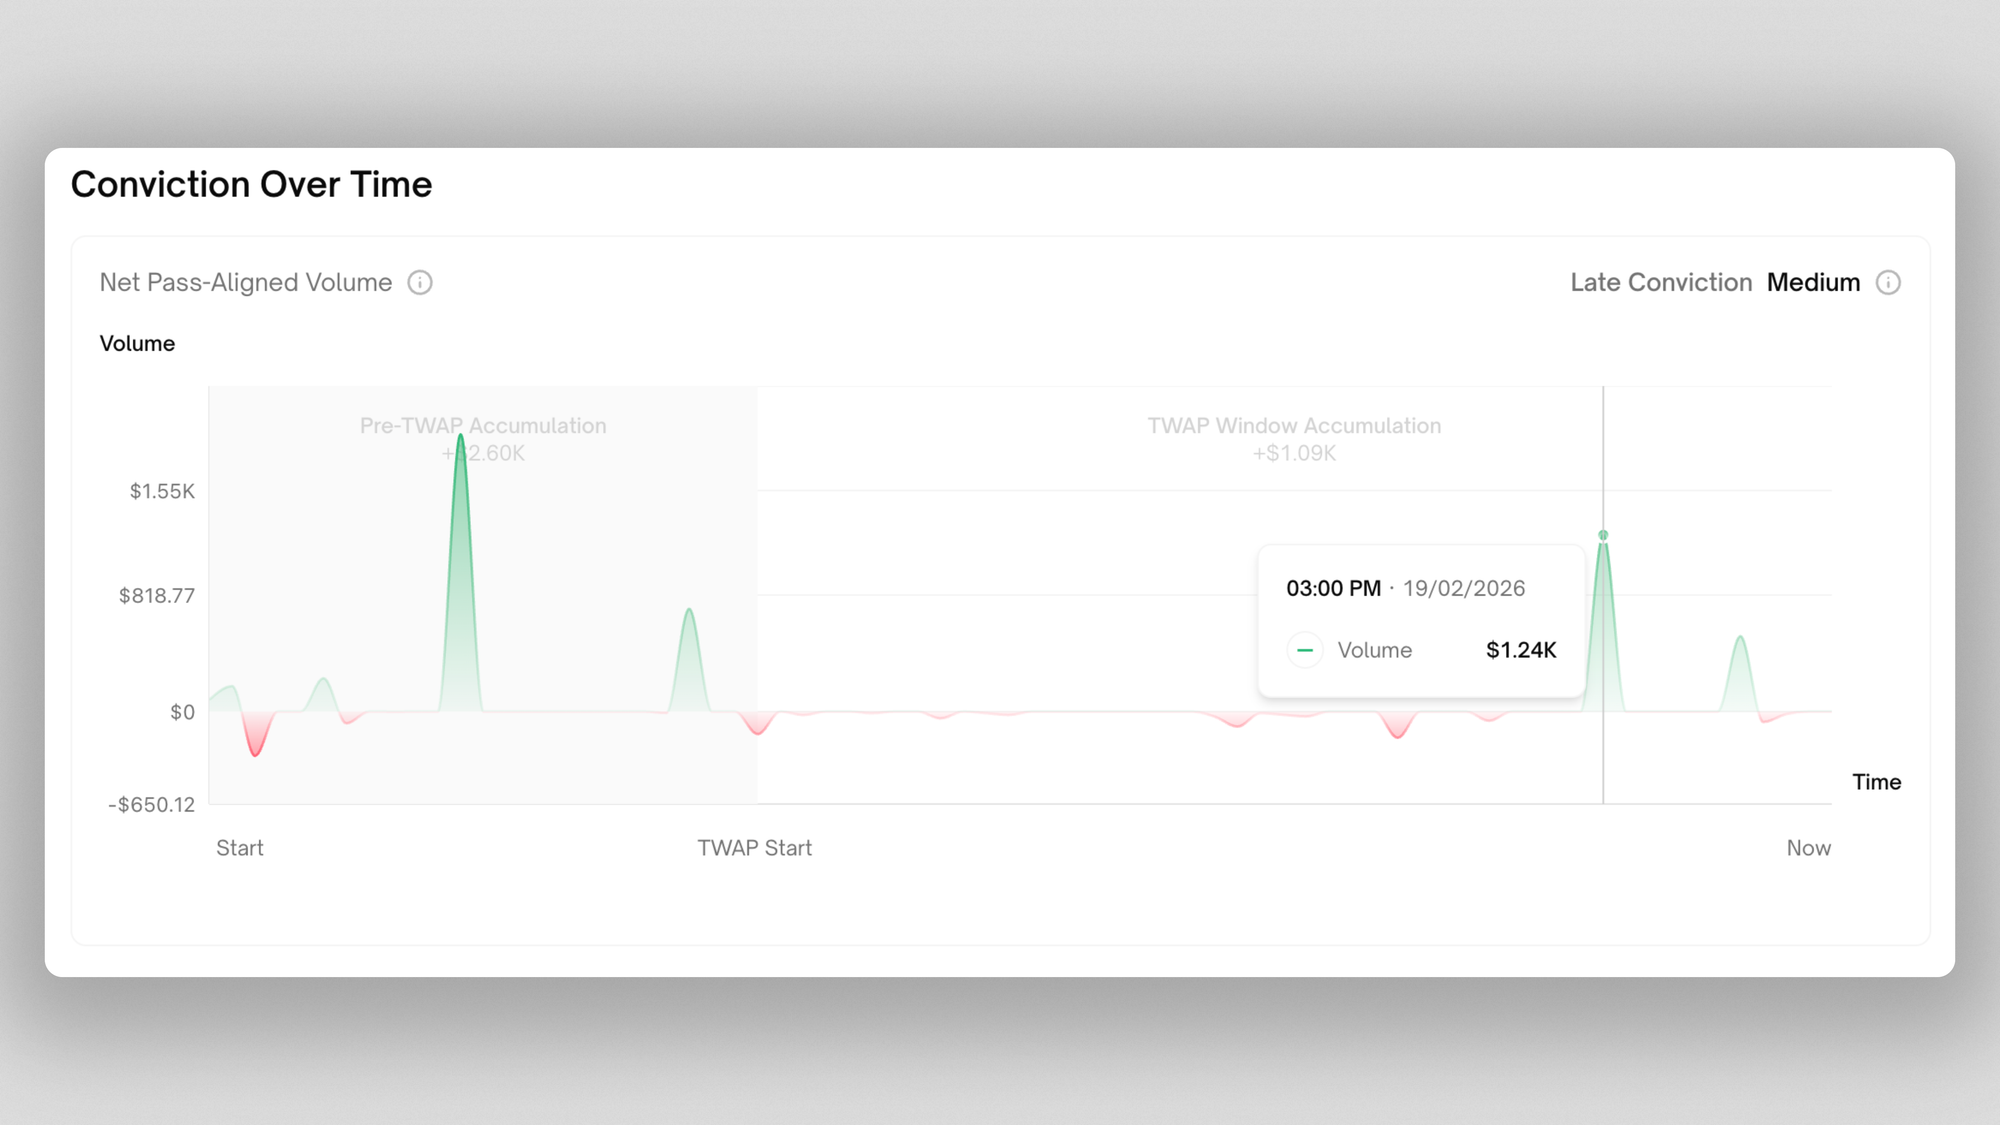
Green bars represent intervals where net capital increased Pass exposure. Red bars represent intervals where net capital increased Fail exposure.
The shaded regions separate:
- Pre-TWAP Accumulation
- TWAP Window Accumulation
For OMFG-003:
- Pre-TWAP Accumulation: +$2.60K
- TWAP Window Accumulation: +$1.09K
This chart tells you whether conviction was built early, strengthened during the TWAP window, or decided late. This separation is important analytically, as some proposals pass with early conviction, while others can flip later on. In the case of OMFG-003, there was early conviction and additional Pass-aligned capital that entered during the TWAP window, reinforcing the signal.
Trade Activity
This section focuses on how participants actually traded, not just where the market ended.
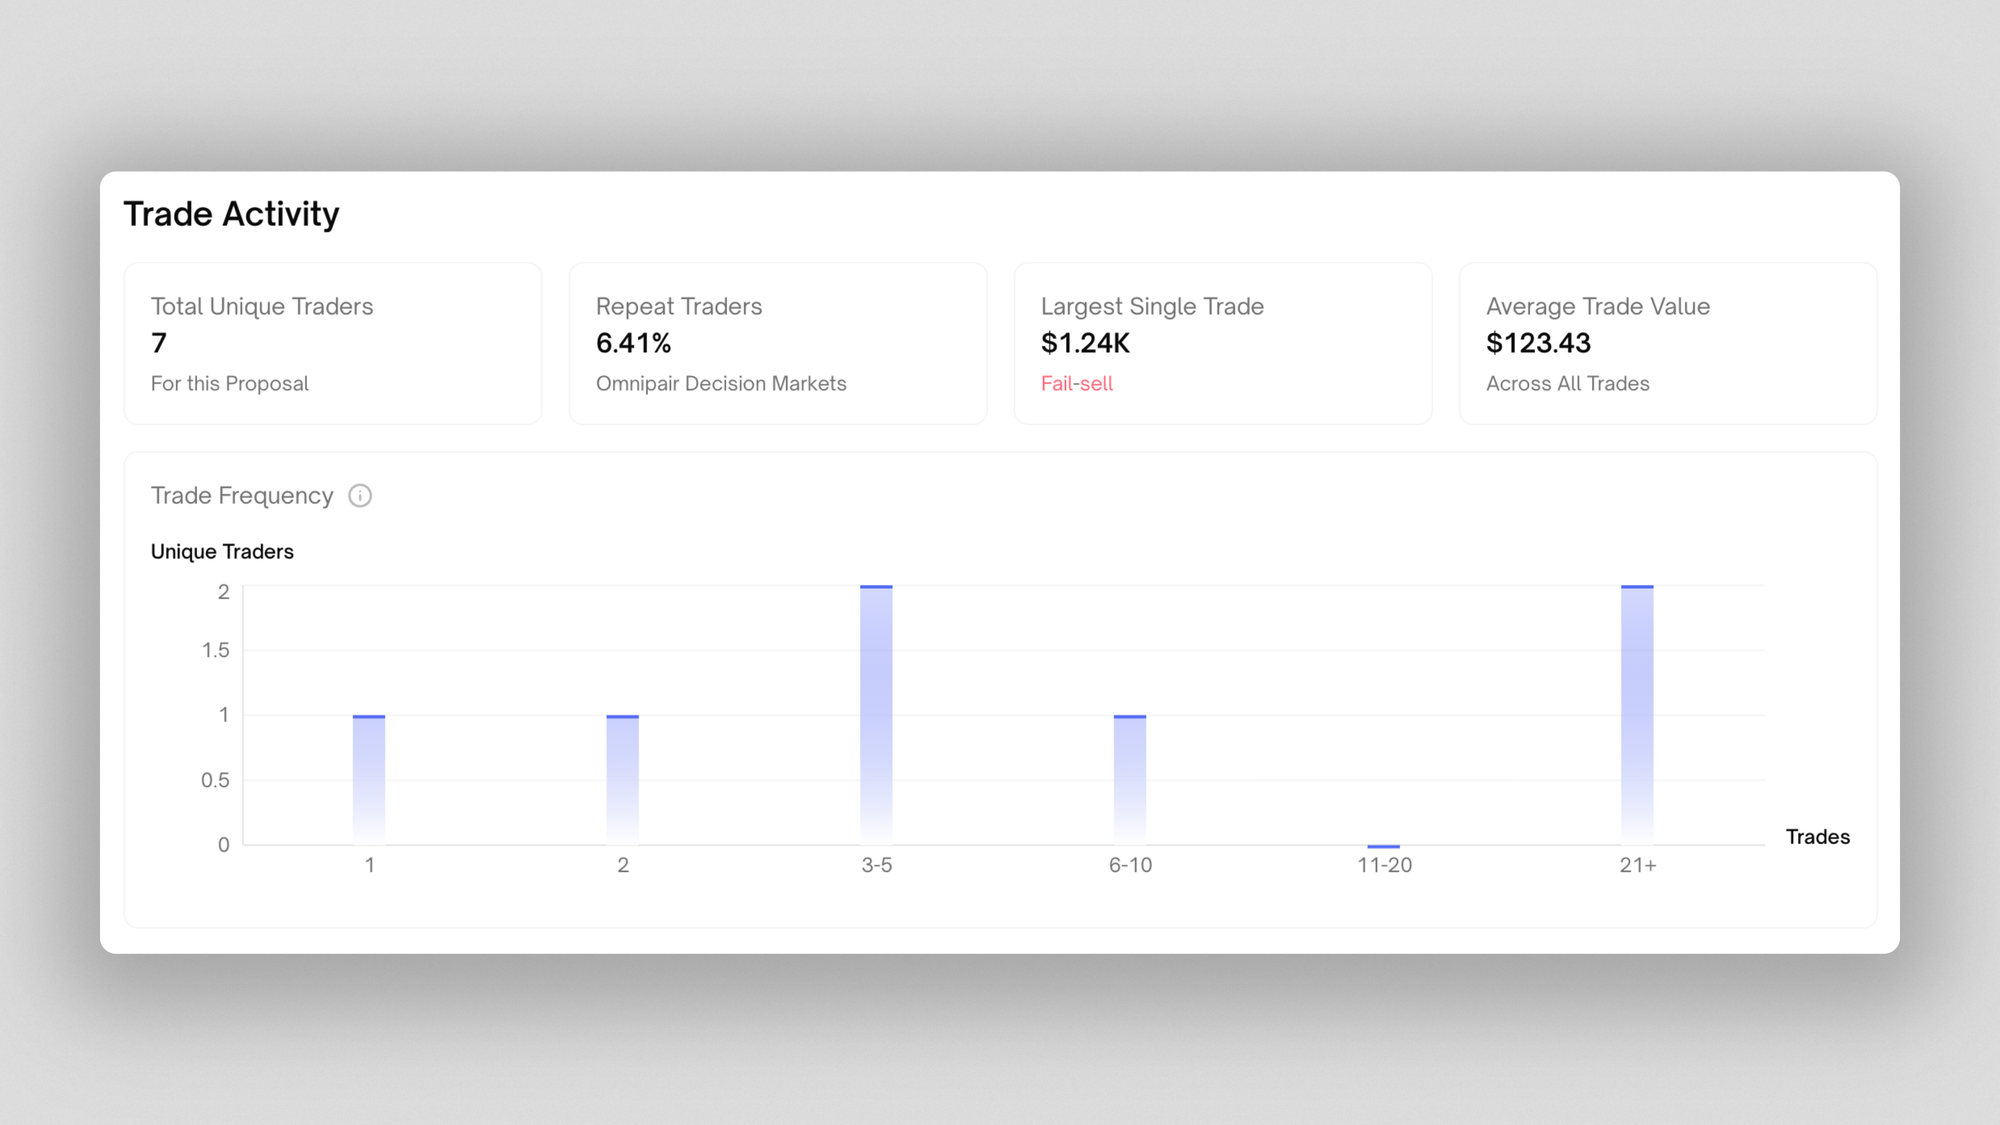
Total Unique Traders
This tells you how many distinct wallets participated in the decision market. A high number suggests broad engagement, while a low number suggests the signal may have been driven by a small group.
This helps you interpret how distributed the decision market signal was.
Repeat Traders
This measures how many participants in this market have previously traded in another decision market for the same organization.
Higher repeat participation can indicate:
- More familiarity with the organization and its proposal history
- An established returning trader base in that organization’s markets
It may also indicate:
- Participation is concentrated among a smaller recurring group
Low repeat participation may suggest:
- Limited continuity across markets
- Infrequent or inconsequential proposals
It may also indicate:
- A fresh participant inflow into the organization’s decision markets.
Analysis of repeat traders should be interpreted alongside participation breadth and depth.
Largest Single Trade
This highlights the single biggest trade executed in the market.
It helps identify whether:
- A large position materially influenced price
- The market was shaped by one dominant participant
The direction of the trade (Pass or Fail, Buy or Sell) shows which side received the strongest single capital push.
Average Trade Value
This provides context for trade sizing. A high average trade size relative to total volume suggests concentrated positions, while a low average may suggest many smaller trades contributing to price discovery.
Trade Frequency
The histogram shows how active participants were.
- 1-2 trades is typical, traders voicing a specific point of view
- 3-10 trades is high engagement, likely a high frequency trader or bot
- 21+ trades is typical of an arbitrage or high frequency trading bot
This helps distinguish between those entering once or twice versus active traders adjusting exposure throughout the market trading window.
It reveals whether the market behaved like a one-time vote or a continuously traded instrument.
Closing Summary
A decision market resolves to a spread, but that spread is shaped by how capital moved and when it moved. With 01Resolved, you can see how the edge formed, whether the outcome was supported by many traders or a few large wallets, and whether conviction held up during the TWAP window when the outcome was determined. Those differences matter. A proposal that easily clears the threshold with steady reinforcement from many participants is a stronger signal than one that marginally passes because a single wallet dominated trading activity.
The takeaway is this: don't just look at the final outcome, analyze why a proposal passed or failed and how durable the conviction was over time. In doing so you will get a good read of the market sentiment.
In Part 2, we turn that understanding into trading strategies.