

Spot price tells you what the market will pay for a token today but it doesn’t tell you how much treasury value is backing the organization, how much capital remains to fund the roadmap, or whether the market is valuing the operating business above or below its balance sheet value.
Net asset value, or NAV, is a balance sheet metric that fills those gaps. It matters for ownership coins because these projects are tied to organizations with treasuries, governance processes, and capital allocation decisions. While NAV doesn’t explain the full value of a project, it does tell you what the project has to work with and what each live token is backed by.
There are different versions of NAV, and they're useful for different types of analysis. In this article we walk you through what each means.
Total NAV vs. NAV Per Adjusted Supply
The first is project-level NAV:
Total NAV = Non-Native Treasury Assets − Liabilities
Total NAV answers “how much non-native treasury value does the organization have?” It is the starting point for treasury analysis, runway analysis, budget proposals, and capital allocation. If a project has a treasury and a monthly spend rate, Total NAV is the capital base being spent down or compounded.
The second is token-level NAV. There is more than one way to express NAV on a per-token basis. The one we use in this article is NAV per adjusted supply:
NAV/AS = Total NAV ÷ Adjusted Supply
NAV/AS answers “how much treasury value backs each live token?” It is the starting point for comparing token price to treasury backing, and the relevant number for premium and discount analysis, dilution, buybacks, and liquidation/distribution discussions.
In summary, Total NAV tells you what the organization has, whereas NAV/AS tells you what each live token is backed by.
An Example
Suppose an ownership coin has $2.1M of non-native treasury assets, $100K of liabilities and 10M tokens in adjusted supply.
Total NAV = $2.1M − $100K = $2.0M
NAV/AS = $2.0M ÷ 10M = $0.20
Now imagine the team has a $100K monthly allowance. Total NAV divided by this allowance implies about 20 months of runway. The $0.20 NAV/AS figure tells you the per-token treasury backing. And if the token trades at $0.15 while NAV/AS is $0.20, the token is trading below its per-token backing (a discount) which is both a valuation and liquidation signal.
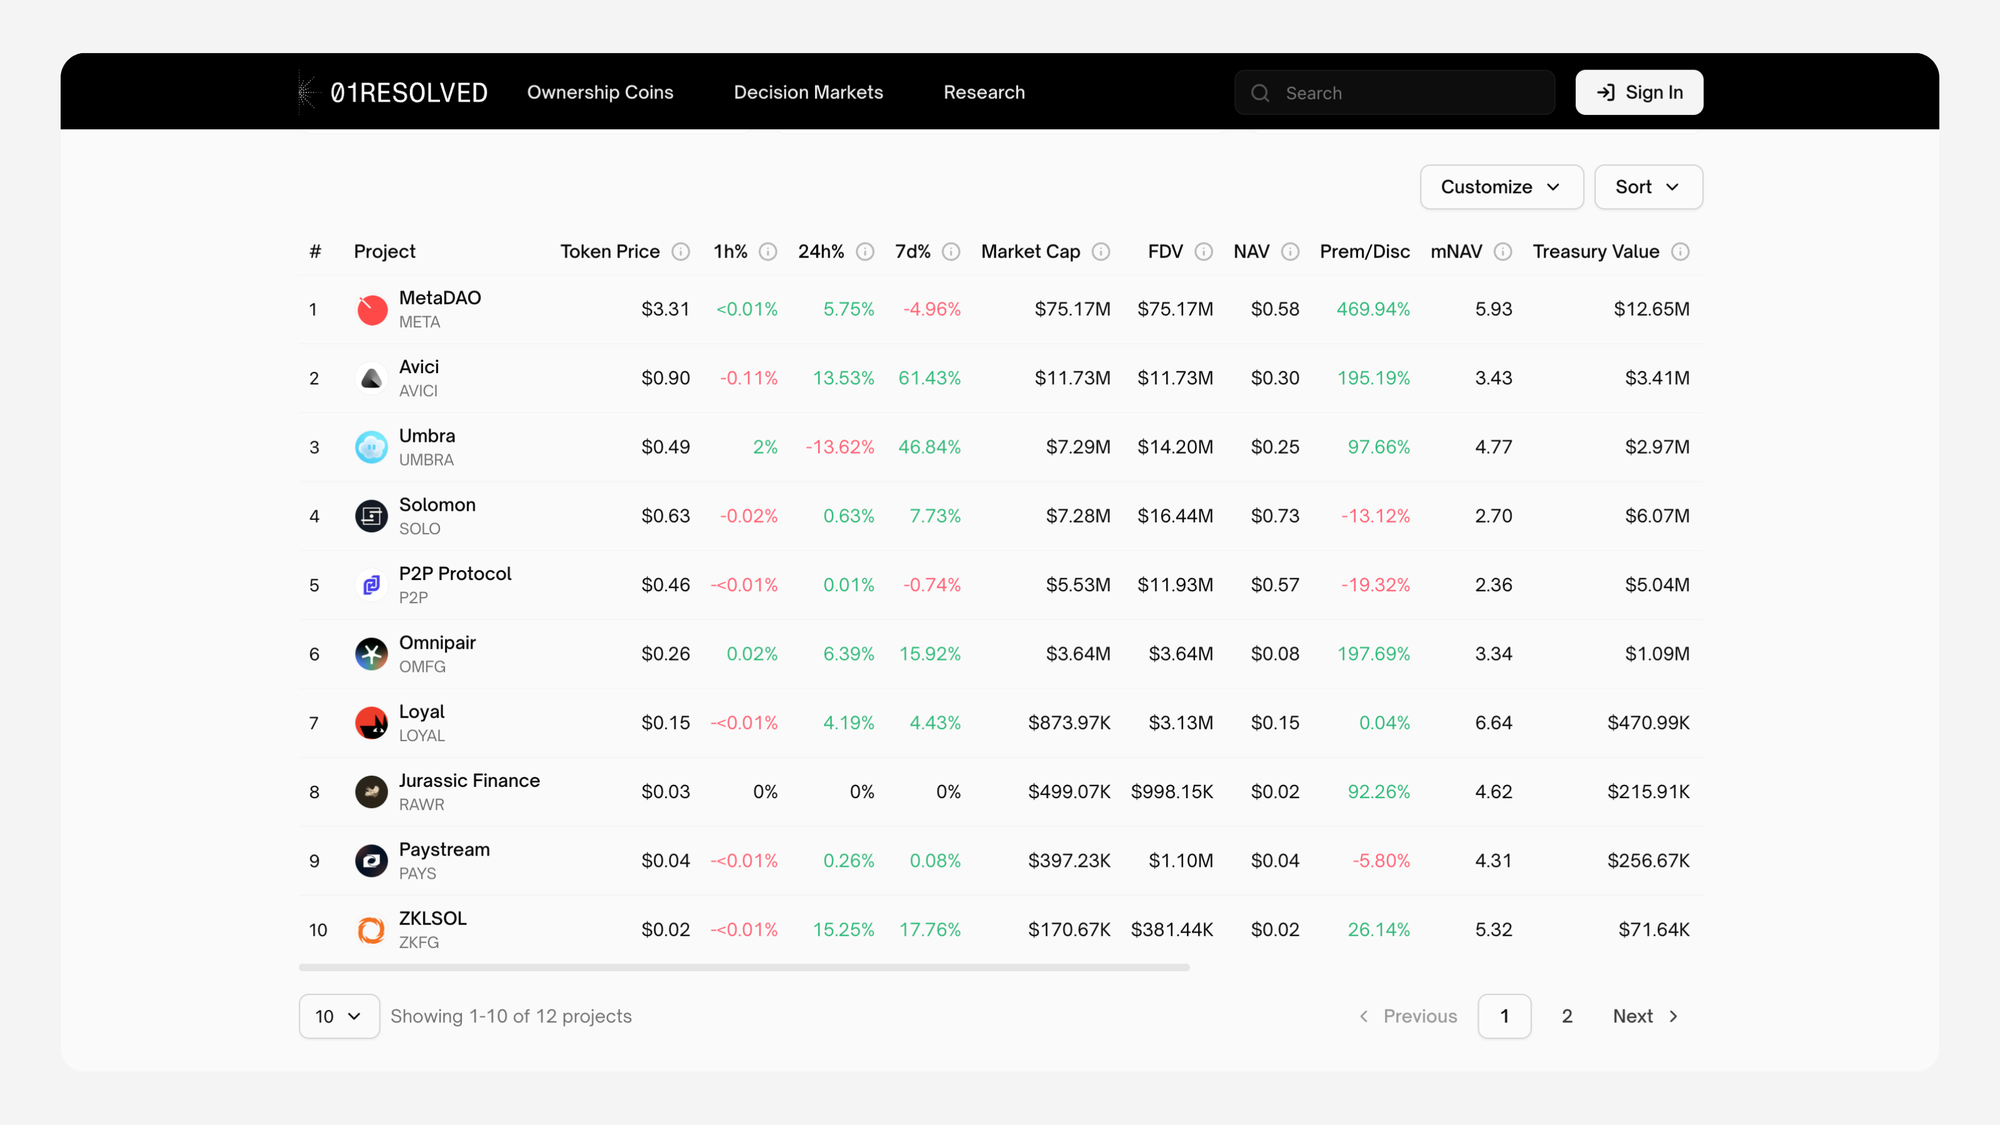
What Counts in Crypto Treasury NAV
Total NAV starts with non-native treasury assets held by the organization. This includes stablecoins, protocol-owned liquidity, investments, and other tokens. The project's own token should be reported separately and should not be included in Total NAV.
Liabilities should be subtracted from NAV. This includes things like accrued expenses, unpaid obligations, and commitments that reduce the assets available to holders. A treasury with $2M of assets and $500K of obligations is not in the same position as one with $2M and no obligations.
For runway analysis there is one more distinction. Protocol-owned liquidity is treasury value but not free runway. To spend it the team has to withdraw it from the AMM, thinning the pool. A thinner pool can prompt token holders to sell, which swaps stablecoins out of the position and the native token in, shrinking overall stablecoin balances further.
As such, the organization runway can be treated as a range. The high-end of runway looks at all treasury assets, the low-end of runway looks at all treasury assets less the non-native protocol-owned liquidity position.
Why Adjusted Supply Matters
Adjusted supply is the live token base in the denominator of NAV/AS. It starts with total native token supply and subtracts tokens that do not represent a live claim on the treasury value. This is typically protocol-controlled native tokens, locked allocations, and the unvested portion of vesting allocations.
The goal is to separate the tokens that are live today from the tokens that may enter live supply later. If excluded tokens unlock, adjusted supply rises, and all else equal NAV/AS falls even though Total NAV has not changed.
A NAV report should show a Total NAV reconciliation, the adjusted supply calculation, and the categories of supply that were included and excluded.
What NAV Misses
NAV is a balance sheet metric. It is based on treasury assets and nothing else, and it does not measure the whole value of an ownership coin.
A young project may have most of its value off the balance sheet and represented by product quality, the team, users, revenue potential, distribution, brand, and future growth potential. NAV doesn’t capture any of this. This is important for analytical purposes because when an early stage team spends treasury to build a product and acquire users, Total NAV falls, but value is not necessarily destroyed. A balance sheet asset has been converted into off balance sheet value, which is normal in early stage company growth.
It is also why a token can rationally trade above NAV/AS as the market may believe the project will turn today's treasury into a more valuable business in the future. And it is why a token can trade below NAV/AS because the market may believe the operating business is weak, the treasury will be spent poorly, or holders may never realize the balance sheet value.
NAV Across the Lifecycle
NAV means different things at different stages of a project's lifecycle.
For an early stage ownership coin (where most ownership coins are today) Total NAV is the remaining capital base, and the team’s job is to deploy it to build a product, find users, and reach the next revenue or financing milestone. A falling Total NAV is not automatically bad here because spending the treasury is the point.
But a falling Total NAV is only acceptable if the burn is converting into something meaningful. The team should be able to show what the treasury spend produced. This can be the product shipped, active users, retention, revenue, transaction volume, liquidity, or another metric that corresponds to the organization's progress.
For a mature ownership coin the logic inverts. The product is built, revenue is more predictable, and NAV becomes less a measure of remaining runway and more of a measure for whether the organization is compounding value. Few ownership coins are there yet, which is why this article stays focused on the early end.
Why NAV Matters
NAV is one of the most useful numbers an ownership coin can publish. It makes the balance sheet legible, comparable, and it adds discipline and context to governance decisions.
NAV/AS matters most when token price moves far away from it. If spot trades below NAV/AS, the market may be valuing the treasury above the operating business, which can create liquidation pressure, especially if holders believe the team is not converting treasury spend into progress. If spot trades far above NAV/AS, the market is paying for expectations beyond the balance sheet, which may be justified while the project is growing, but leaves the premium fragile if the growth story weakens.
NAV is a great reference point that explains what the token is resting on, before any judgment about what the project can become.
What a Good NAV Reporting Should Include
The best version of NAV reporting publishes four things together:
- Total NAV, with non-native assets and liabilities reconciled.
- NAV/AS, with adjusted supply and supply exclusions shown clearly.
- A time series, so holders can see how the numbers changed.
- Operating metrics, so holders can judge whether treasury spend is producing durable progress.
That standard lets investors ask better questions. Is NAV/AS falling because of dilution? Is the project converting burn into usage, revenue, liquidity, or retention? Is the spot price trading at a premium or discount to NAV/AS?
Conclusion
Understanding NAV starts with separating the project-level number from the token-level number.
Total NAV is non-native treasury assets minus liabilities. It tells you what the organization has, and it is the starting point for runway, burn, and treasury analysis. NAV/AS is Total NAV divided by adjusted supply. It tells you how much treasury value backs each live token, and it is the starting point for price comparison, premium and discount analysis, dilution, buybacks, and liquidation analysis.
Neither number shows the full picture of where the product is at. NAV explains the balance sheet, progress metrics explain whether that balance sheet is being converted into a more valuable organization.
This article introduced the NAV framework. The next piece, Putting NAV to Work, shows how to use it.